
A sports analytics dashboard should make a specific decision easier. A coach reviewing an opponent, an analyst comparing players and a commercial team evaluating sponsorship need different views, even when some of their data comes from the same provider.
Effective sports analytics dashboard design starts with those decisions, then defines the metrics, context and evidence needed to support them. Adding more charts before agreeing on the user task produces a larger interface without necessarily producing a better answer. The process below is a proposed design framework, illustrated with hypothetical football examples rather than client performance claims.
Key Takeaways
- Define the user, decision and next action before selecting charts.
- Show metric definitions, comparison periods and data coverage alongside results.
- Distinguish missing data from zero, and provisional data from finalized data.
- Preserve filters and source context when a user exports or shares a view.
Start with a question the dashboard must answer
Write a one-sentence job for each main view. For example: “An analyst needs to identify which opposition matches deserve closer video review before preparing a coaching report.” This is narrower and more testable than “show team performance.”
List the decisions the interface supports and those it does not. A match summary can help an analyst choose where to investigate; it cannot independently establish why a player made a decision. That distinction affects how confidently the interface should describe a pattern.
Interview the people who will use the output, including recipients of exported reports. Ask them to bring an existing spreadsheet, presentation or workflow. Look for the comparisons they repeat, the definitions they explain to colleagues and the information they distrust. These questions help identify the dashboard's necessary structure without assuming every metric deserves a prominent card.
| User task | Main view | Useful next step |
|---|---|---|
| Review one match | Match summary with selected metrics | Inspect the underlying events |
| Compare player candidates | Comparable player table | Review minutes, role and footage |
| Prepare an opponent report | Filtered team trends | Save an annotated evidence set |
| Monitor data delivery | Coverage and freshness overview | Investigate missing or delayed feeds |
Treat these as starting hypotheses. A recruitment analyst and a coach may use similar labels while requiring different filters, permissions and levels of detail.
Define the metrics before designing their cards
Every prominent metric needs a clear meaning, unit and denominator. “Shots” may be a count for a match, a season total or a rate over playing time. The interface should not leave users to infer which one it shows.
Create a metric dictionary with the display name, definition, source, calculation, time window, rounding rule and known limitations. Agree on who owns changes to that dictionary. A redesign can otherwise make old and new figures look comparable when the calculation has changed.
Expected goals is a useful example. Hudl Statsbomb describes xG as an estimate of the probability that a shot produces a goal, and explains that models use different contextual inputs. Therefore, a dashboard should name the model or provider rather than treating every xG value as interchangeable. Hudl Statsbomb: Expected Goals Explained
For a hypothetical player comparison, display the selected season, competition, minutes played and metric definition beside the chart. If the interface offers a per-90 rate, label it explicitly and expose the minimum-minutes filter. Do not imply that normalization alone makes different roles or competitions equivalent.
A compact explanation can sit near the metric, with fuller methodology available on demand. Avoid making a tiny tooltip the only place where essential qualifications appear, especially when the view is later exported.
Make data provenance part of the interface
Data provenance answers where a value came from and which transformations produced it. Users need enough of this information to interpret a result and investigate a discrepancy.
At minimum, specify a source label, coverage period, last successful refresh and status. Separate the event time from the time your system received the data. A recently refreshed dashboard can still contain delayed observations.
The StatsBomb open-data repository illustrates why coverage needs explicit treatment: it organizes data by competitions, seasons and matches, with events, lineups and selected 360 data. The presence of one data type does not establish availability of every other type for every match. Hudl/StatsBomb Open Data
For production, confirm commercial data rights and the actual provider contract. Public sample data may be useful for a prototype, but it does not establish the licensing, latency or completeness of a live product. Keep sample and production sources visibly distinct during design reviews.
Build a short diagnostic path into the experience. A user who questions a value should be able to see its definition, applied filters and source record without contacting several teams. The exact depth depends on the audience; a coach may need a concise explanation while a data analyst needs the underlying event identifiers.
Use a hierarchy that supports investigation
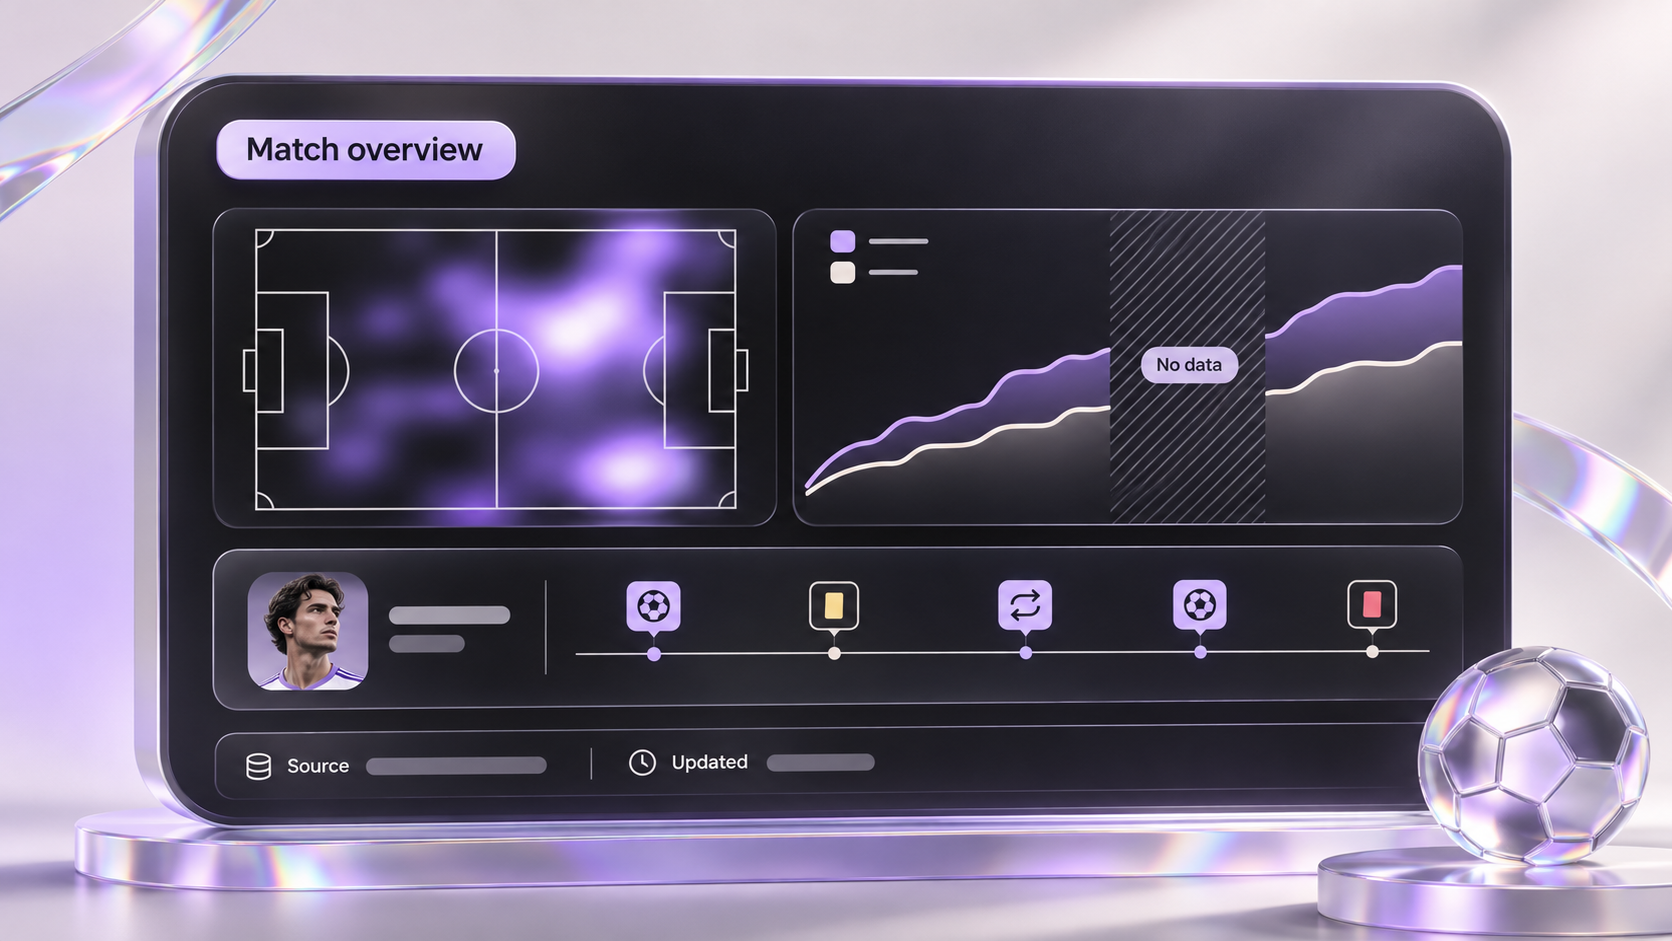
A useful dashboard can move from overview to comparison to evidence. The overview identifies a pattern, the comparison puts it in context, and the detail lets the user inspect the underlying observations.
In a hypothetical opponent-analysis view, the overview might show a selected match set and a small number of agreed indicators. A comparison panel could separate home and away matches. An event table could then connect a selected pattern to clips or records, where the product has those rights and integrations.
Choose chart forms according to the question. A line chart can show change across an ordered period; a table can support precise lookup; a dot plot can compare values against a common scale. A pitch map is useful when position is part of the question, but it should not be added merely to make the interface look like a sports product.
Keep legends, units and comparison groups visible. W3C's guidance on color requires that color not be the only visual means of conveying information. Direct labels, symbols and text states can help a chart remain understandable beyond its palette. W3C: Use of Color
Give comparisons a consistent scope
Filters are part of the analysis, not incidental controls. A result changes meaning when the user changes the competition, season, match set or player role. Show active filters clearly and explain whether a filter applies to one panel or the entire page.
Avoid quietly comparing a full season with a partial season. If a comparison is allowed despite different coverage, show that difference where the user sees the result. Keep the meaning of “reset” predictable: it should return to a documented default rather than an unexplained combination of old settings.
For shared links and exports, preserve the filters, selected entities, source labels and generation date. If permissions prevent another user from opening the same data, explain the access issue rather than showing an empty chart that looks like no activity.
Design missing and changing data deliberately
Zero means an observed value of zero. Missing means the system does not have a usable observation. Conflating them can change the interpretation of a player's performance or a team's activity.
Define these states in the design system:
| State | Recommended presentation |
|---|---|
| Loading | Explain which view is loading without showing invented values |
| No matching records | Show active filters and a clear adjustment path |
| Missing coverage | State which source or period is unavailable |
| Provisional result | Identify the result as subject to correction |
| Refresh failed | Keep valid previous data with its timestamp and status |
| Access restricted | Explain the permission boundary without exposing protected data |
Choose refresh behavior according to the task. A live monitoring view and a saved post-match report have different expectations. Do not silently replace values while a user is annotating a report; offer a clear update path and preserve the version associated with their notes.
Test interpretation, not just navigation
Ask representative users to explain what a chart means and what they would do next. Someone can navigate successfully while drawing the wrong conclusion from a metric or comparison.
Use test questions such as: Which period does this value cover? Why do these players have different sample sizes? Is the data complete? Which events support this pattern? What will a colleague see when this report is shared?
Record the answer, confidence and evidence used. Correct misunderstandings in the interface before adding more controls. For engineering acceptance, verify filter persistence, rounding consistency, source labels, unavailable states, exports and permission handling against known test records.
Prepare a brief that connects design and data
Before commissioning the dashboard, gather the primary user roles, example decisions, metric dictionary, provider documentation, sample records, access model and current reporting workflow. Include difficult records such as missing values and corrected events. A set of ideal screenshots cannot expose those requirements.
Assign ownership across product, design, data engineering and application engineering. The design team defines presentation and interaction; the data team validates calculations and provenance; engineering implements reliable access and updates. Agree on the shared acceptance criteria before evaluating the final visuals.
To develop a dashboard brief, share the decisions, data sources and existing views you want reviewed. A clear example of a difficult analytical task is more useful than a long list of charts.